As stewards of the infrastructure that supports our state’s businesses and families, Virginia’s civil engineers periodically assess the current condition and outlook for infrastructure using the familiar form of a school report card—assigning letter grades that are based on physical condition and needed investments. The findings show we must actively work to implement effective solutions that will raise Virginia’s grades. Solutions to raise the grade include:
- Increase Leadership in Infrastructure Renewal Virginia’s infrastructure is the responsibility of all our leaders. We need bold leadership and a vision for how strategic infrastructure investment can improve the current status quo.
- Promote Sustainability and Resilience Today’s infrastructure must meet the state’s needs in the best and worst of times, and also protect and improve the environment and our quality of life.
- Develop Comprehensive Strategies Virginia should prioritize and execute infrastructure strategies that put our investments where they are needed most, according to well-conceived plans that focus on comprehensive solutions that provide a good return on investment.
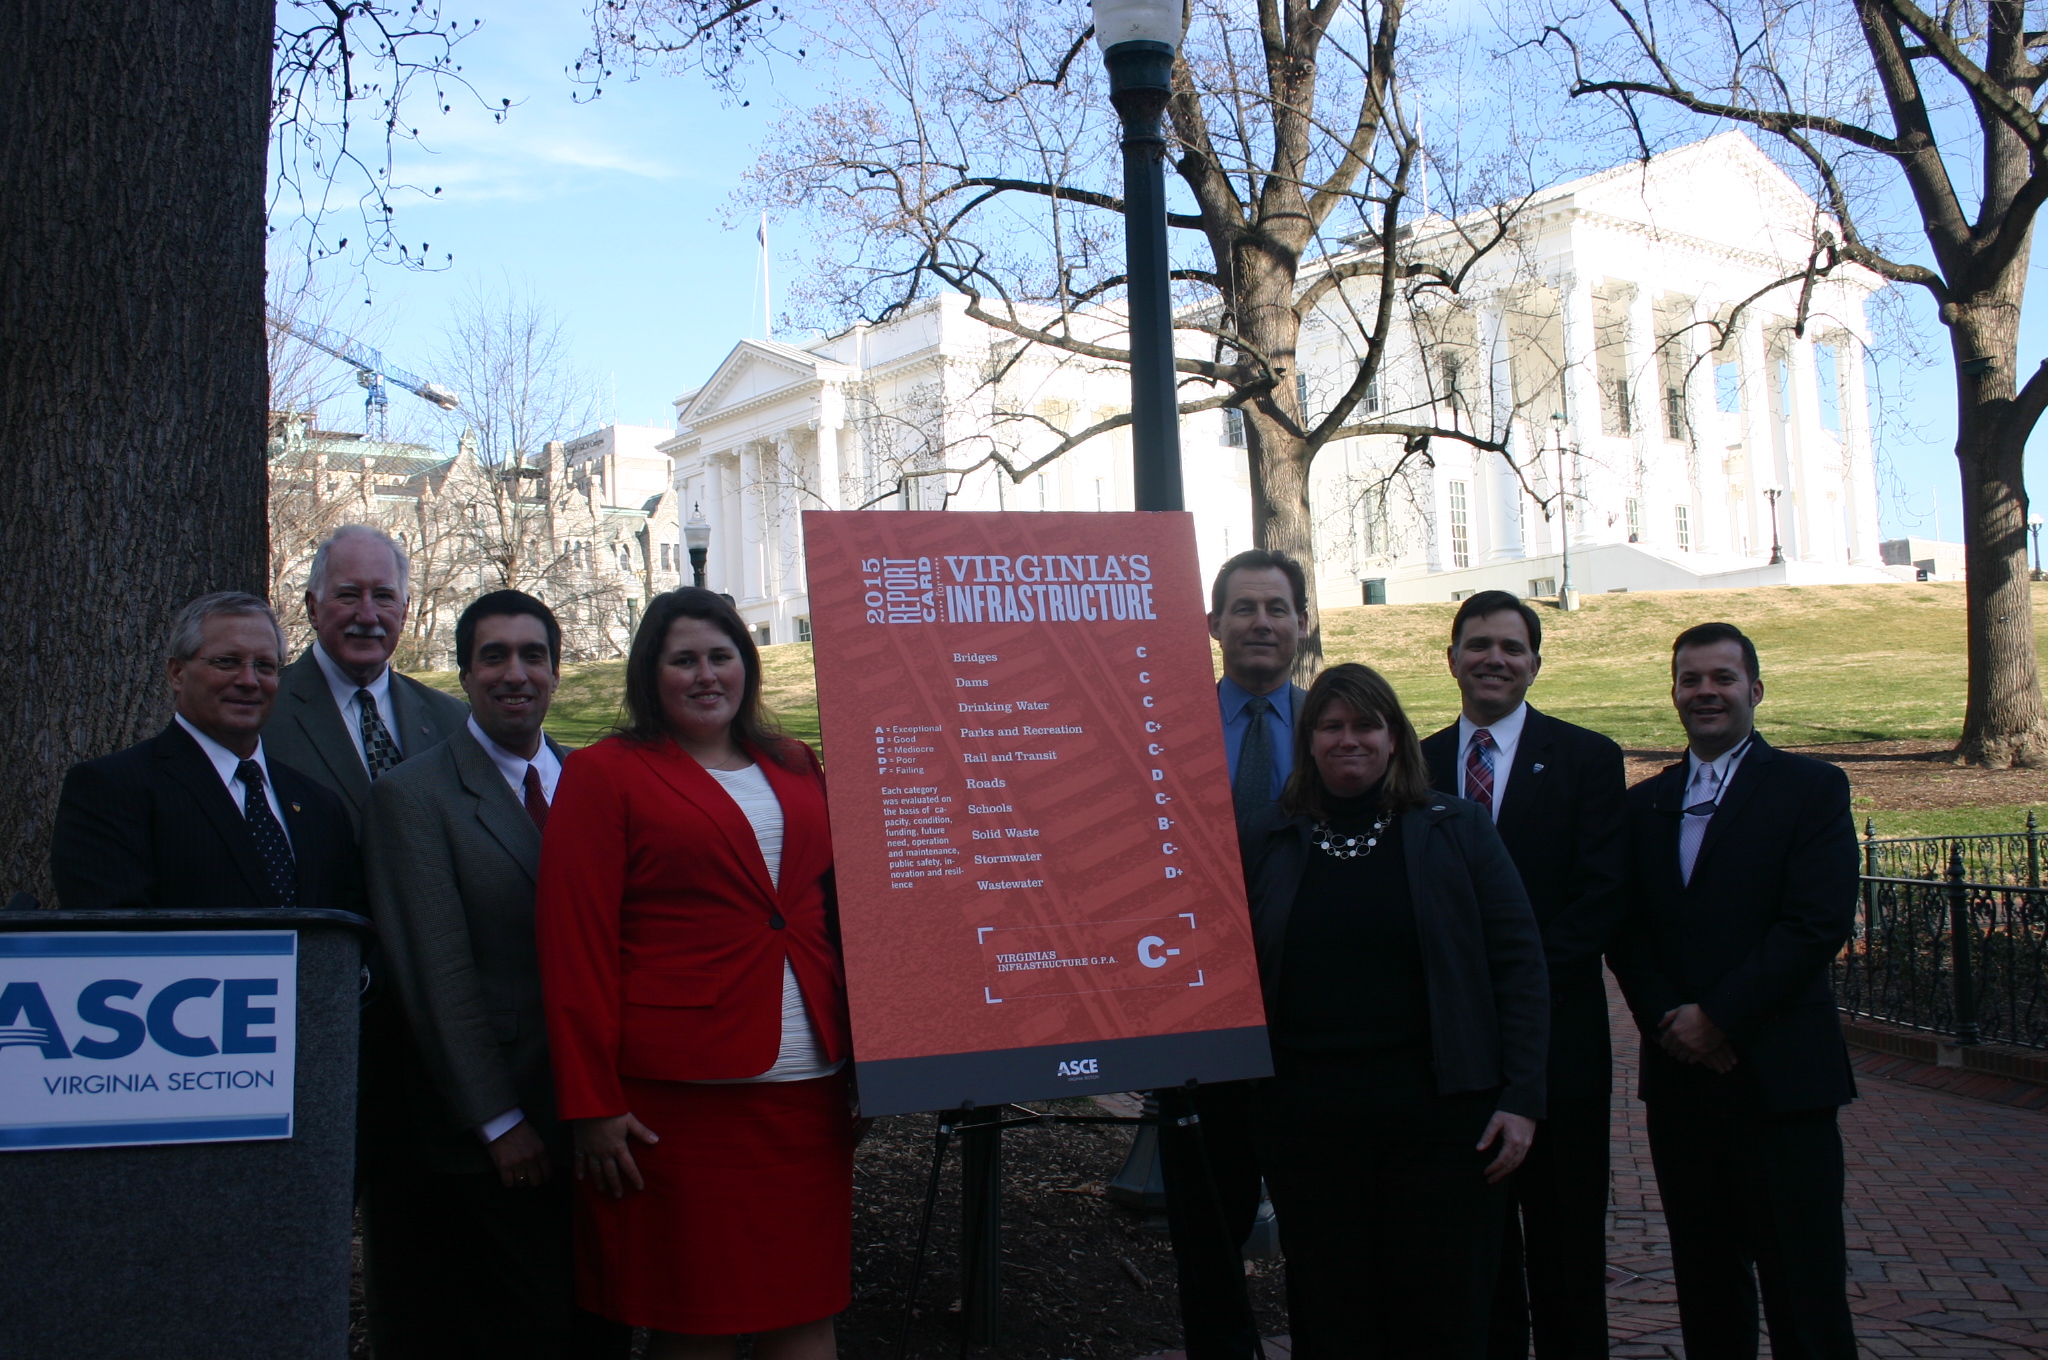
Bridges C
Virginia has 20,997 bridges and culverts in our inventory, and the overall health of our bridges is in decline due to age and lack of funding. 56% of Virginia’s structures are approaching the end of their anticipated design life having been in service for more than 40 years. As part of this, 30% are over 50 years old. Virginia’s structures must be inspected regularly, with an average of 10,700 inspections annually so their condition can be evaluated. In 2013, Virginia’s inventory included 23.2% that were either structurally deficient or functionally obsolete. Of the major Virginia structures on the National Bridge Inventory, about 1 in every 4 bridges are structural deficient (meaning that they require maintenance, rehabilitation, or replacement) or functionally obsolete (meaning they no longer meet today’s design standards). These 4,871 structurally deficient or functionally obsolete structures are primarily a result of the gap between required and available funding. Available funds are often used to address immediate repair or replacement needs, leaving few remaining funds for preventative maintenance. Additionally, smaller structures have often been given funding which decreases the number of bridges requiring attention, but leaves a backlog of deferred maintenance on larger, more expensive structures. The statistics indicate an impending peak of replacements which may be required within the next 10 years and perhaps sooner, if needs are not addressed at a higher rate.
Dams = C
Dams provide numerous benefits to Virginian’s including recreation, water supply, irrigation, flood control, and hydroelectric power generation. There are only two natural lakes in Virginia, Lake Drummond and Mountain Lake; however Virginia has about 4 dams within every 100 square miles. Virginia’s dam inventory continues to grow older and more susceptible to damage. The majority of dams in the state were built 1950-75, and their average age is over 50 years old. With 1,789 regulated dams, Virginia ranks 11th nationally for having the most regulated dams. Dam safety officials regulate 312 high hazard dams, which is an increase of 82 dams since 2011, and 141 of these dams, or 45%, have Conditional O&M Certificates, indicating that they do not meet current dam safety standards. The estimated rehabilitation cost for 440 high and significant hazard dams in Virginia is $592M to address deficiencies. While funding for dam safety has increased since 2008, it is small by comparison to $592M in deficiencies, and in order to ensure the safety of those downstream a continued investment in bringing all dams into full compliance with the current regulations is needed.
Drinking Water = C
Virginia saw a large growth in public water systems after 1940, and Virginia now has 2,830 public water systems providing drinking water to more than 7M Virginians. Of this, 91% are served by waterworks that reported no water quality violations, however a large number of these systems have passed 70 years of age. Many require significant asset renewal in the immediate future. EPA’s latest assessment showed Virginia’s waterworks need nearly $6.1B to maintain our drinking water systems over the next 20 years. However, at only 72% of the national average, we must be diligent in identifying, defining and quantifying our needs to justify increased federal funding. From 2000 to 2012, Virginia was awarded $200M in Drinking Water State Revolving Funds. This investment addresses less than 10% of the total needs. In spite of increased needs, the award for 2012 was even less... at 5% of the total need. Deferral of the necessary improvements has worked so far, but can result in degraded water service, water quality violations, health issues, and higher costs in the future. A more robust plan to maintain our drinking water infrastructure is needed to avoid future problems.
Parks and Recreation = C+
Virginia’s public parks and recreation facilities are a diverse combination of national, state and local destinations which provide more than $18B in economic benefits annually from outdoor recreation in Virginia. When comparing the revenue generated by our state parks to the economic investment in the state’s general fund, it represents a return on investment of almost $11 for every $1 of general fund spending. However, Virginia has 5 new state parks which lack enough funding to develop and open to the public. Virginia also has more localities with vacant or missing positions for parks directors than was the case 5 years ago, for our last ASCE report card. For these reasons, the ASCE parks report card grade has been lowered. While park attendance in Virginia is on the rise, and our parks are consistently ranked as some of the best in the nation, leadership is needed to reverse recent trends. Open space and recreational opportunities are integral to our economy and our way of life in Virginia, and a lack of commitment to adequately fund and maintain our facilities will change things for future generations.
Rail and Transit = C-
With 3,200 miles of railways across Virginia and some of the largest port facilities on the East Coast, we rank as one of the top states where freight carloads terminate, including 2 large Class I railroads and 9 Class III carriers. Amtrak and Virginia Railway Express (VRE) also have experienced explosive growth in passenger rail ridership using shared tracks for almost all of their routes. Recent reports cite limitations throughout Virginia’s railroad system that prevent the railroads from routing traffic over the primary corridors, with no high speed rail strategy for transit in the works. While some improvements have been made, Virginia will have to decide how to handle a doubling of rail traffic expected by 2035 including increasing passenger traffic. Realizing the importance of rail to Virginia’s movement of goods and economic vitality, Virginia developed its first dedicated source of funding, the Rail Enhancement Fund, for freight and passenger rail improvements in 2005. The Intercity Passenger Rail Operating and Capital Fund was also passed by the General Assembly in 2011, but no funding has been appropriated to the fund yet. While both funds can represent progress, the current funding is not sufficient to meet the increasing demand for rail and passenger service or to complete the much-needed rail infrastructure improvements and upgrades.
Roads = D
For decades Virginia’s roadways have provided safe, convenient travel for its citizens with the nation’s 3rd largest state roadway system. While the condition of the Commonwealth’s roadways are tolerable from a maintenance and safety standpoint, a lack of capacity results in traffic congestion and gridlock, especially in Washington DC-VA-MD and Hampton Roads regions that negatively impact commuters, industry, and the economy. The Washington DC-VA-MD metro area is ranked second worst nationally, behind Los Angeles. In total, Virginians have spent 28,000 years sitting in traffic based on a recent study, at a fuel cost of $5B, and the average DC-VA-MD commuter experiences 74 hours of travel delay per year – nearly two full work weeks of sitting in traffic. VDOT reports current needs for condition and/or capacity improvements on most of the interstate systems in Virginia including I-64, I-81, and I-95. Looking toward 2035, significant needs exist on all interstate and freight corridors. After 20 years of the status quo in terms of funding, the 2013 legislature made a significant step with House Bill 2313 to provide funding and begin addressing these challenges. However, with a network that has grown by 14% over the last 35 years and with every dollar buying less construction work, more funding is needed to maintain safe roadways while adding needed capacity, making this a high priority issue for Virginian’s.
Schools = C-
Currently, more than 1,800 public school buildings serve Virginia’s K-12 students. To plan, construct, modernize and maintain school buildings that meet today’s educational needs is a challenging task for which local communities, the state and federal government have a role. In 2013, the Virginia Department of Education completed a comprehensive report on the age and needs of our school facilities and they found that more than 60% of our schools are at least 40 years old with estimated renovation costs exceeding $18B for schools over 30 years old. This is up from the $8.5B in estimated funding needs which were cited in 2008. It is not clear why the costs have more than doubled in 6 years, except to show how recent investments are not keeping up with needs. In fact, school construction spending decreased from $536M in 2008 to only $189M in 2009, while needs continued to increase. Encouragingly, the investment has slowly rebounded to 2008 levels so that deferred maintenance can begin to be addressed. Continued investment in our children’s education by providing safe and healthy learning environments is necessary to secure our future.
Solid Waste = B-
In 2013, the 208 permitted solid waste facilities in Virginia processed 20.2M tons of solid waste. Approximately 15M tons originated within the Commonwealth, while an additional 5.2M tons were brought in for disposal from out-of-state sources. For in-state waste, each Virginian averages 5.75 pounds of solid waste per day which is above the national average by about 30%; however, Virginians are doing about 7% more recycling than other states, and a growing number of recycling programs now collectively approach a 50% post-consumer solid waste recovery rate. Reductions in local and imported waste in recent years, along with 11 additional waste facilities are estimated to have increased the available capacity since our last report card from 20 to 22 years, however an additional 50% source reduction could eliminate over one million tons of additional solid waste annually, with an expected savings of some $40M per year to Virginia’s economy. More work is needed to maintain or improve our 22-year capacity to meet future needs; to reduce our reliance on imported waste as a revenue source; and to continue to increase recycling and reduce in-state sources of solid waste.
Stormwater = C-
Stormwater infrastructure protects the health of our streams, rivers, wetlands, and lakes. In Virginia, large needs exist in many municipalities to comply with new stormwater regulations and to keep up with these needs, often with long construction time frames for capital projects making progress challenging. Recent surveys show about one-third of the infrastructure is older than 50 years and much of the remainder was built 25 to 50 years ago. While most stormwater infrastructure has a 50 to 100 year lifespan, keeping up with maintenance and using asset management planning are necessary to not undo the gains in water quality in Virginia’s rivers and the Chesapeake Bay. Increased attention and funding is working in concert with increased regulatory compliance requirements, but there are shortcomings to address for state level standardized reporting, public education, and ensuring a dedicated source of funding commensurate with the economic benefits of a healthy Chesapeake Bay and Virginia ecosystems.
Wastewater = D+
Adequate wastewater treatment is vitally important to a healthy environment, human health and economic vitality. Virginia has $6.8B in wastewater needs over the next 20 years; a 45% increase from our previous report card in 2009. Factors causing this increase include aging infrastructure, more stringent federal regulations to restore water quality, growing demands, and increases in construction costs. Virginia has $1B in identified needs to control combined sewer overflows and prevent raw, untreated sewage from entering into Virginia’s waterways. Significant additional funding is needed to put the Chesapeake Bay and Virginia’s waterways on a “pollution diet” to restore water quality, including a 150-mile Chesapeake Bay “dead zone” between Baltimore and the York River in Virginia. A cleaner Chesapeake Bay is estimated to generate an additional $8.3B in economic benefits annually to Virginia. Virginia has made progress with considerable investments and has a comprehensive plan, but has tremendous challenges ahead. All signs indicate that agricultural sources will not meet their target pollutant reductions discharging to the Bay and wastewater treatment plants may have to increase their pollutant reductions to compensate.